
Introduction
In the field of medical imaging (and probably in many other fields of research), there are usually no ready-to-use, off-the-shelf software packages that can perform all data-processing for complex workflows. Instead, most workflows consist of several individual tools and scripts, which are combined into one complex pipeline (see Figure 1 for an example of such a pipeline). Most tools were written as the reference implementation to algorithms described in some paper and then released on the author's homepage. Some of these tools are aggregated in a software collection, such as FSL or SPM, others are available as individual applications, in binary form or as sourcecode. Some are merely a collection of Matlab scripts available on Matlab Central.

Figure 1: A graph, which describes a workflow. The individual steps (blue ellipses) were performed by different FSL tools. Yellow, orange and red boxes denote input-, intermediate- and output files, resp. The graph was autmatically created from a VHIST file.
When you design your data-processing and -evaluation pipelines, you know exactly what you are after. You know why you use some specific tools and why you use them in a specific combination. This knowledge vanishes pretty quickly once you stop to actively work with the pipeline. Several month later, when the journal publishes your paper and people start to ask for your data, your code, or both, you can probably still reconstruct the general structure of your workflow. It will be much harder to recall the exact versions of the individual tools, the parameter settings and the computers your tests ran on. If you write your own tools or scripts, it is also difficult to retrospectively find out whether your code already included some crucial improvement or fix.
Therefore, a good and complete documentation of your workflow is critical to fully understand what you have done, how you have done it and why you have done something. Creating a documentation, however, is extremely difficult.
Many tools create some kind of documentation; debug output on the commandline, a log file or a PDF or HTML report (some tools do not even provide this kind of documentation). Even if you gather all this information, you end up with lots of individual files. The relation of the individual output files is hard to reconstruct. Handling lots of individual logs and reports is like herding cats. Some of the reports will start to scratch and bite you. There is a good chance that the documentation will be incomplete or misleading. The names of the input and output artifacts might not be part of the logs. Even if they are, how do you make sure that the file on your computer is actually the file, you created. Maybe, somebody opened the file and accidentially modified it.
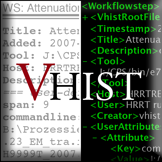
VHIST
We try to solve some of these problems with VHIST. The idea was to develop a file format for meta-documentation, which can store the complete processing history of one dataset within one file. The file format had to be easily readable – for humans and computers, with and without special tools. Further, it needed the ability to store any kind of information available about a processing step. Fingerprints for embedded data assure that the data listed in a VHIST file equals the data on your file system. Last but not least, extending existing documentations by new processing steps is a common use case.
File Format
For more information about the VHIST file format, see the About Page or the VHIST Whitepaper.
Example VHIST files
You can find a number of example VHIST files under Examples.
Reference Implementation
We provide a reference implementation, which includes tools to generate, extend and view VHIST files as well as various programming libraries to integrate VHIST into your own programs. You can find the reference implementation on the Download Page.